LOOKING FOR SOLAR G-MODES
- Les modes de gravité solaires révèlent une rotation rapide de son cœur thermonucléaire
- SoHO/GOLF instrument
INTERNAL SOLAR ROTATION
Symmetric part of the internal solar rotation rate with respect to the equator. Iso-contours are shown every 10 nHz from 300 nHz up to 480 nHz. This was obtained by inverting the frequency splittings estimated from PICARD/SODISM intensity images over the period from April 16 to November 10 2011. The solution below 0.3 solar radius is poorly constrained by the data and is not shown.
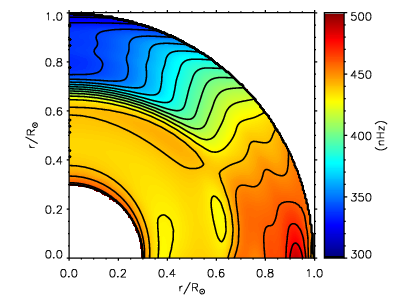
Reference: T Corbard et al 2013 J. Phys.: Conf. Ser. 440 012025 doi:10.1088/1742-6596/440/1/012025
TORSIONAL OSCILLATION
This figure is showing the evolution over time of the residuals of the solar rotation rate. A running mean over 10 years have been substracted to the rotation rate inferred from SOHO/MDI and SDO/HMI f-modes splitting. For the 5 first and last years, the mean over the first and last 10 years are used as reference. The average depth is 0.99 Solar Radius or about 7 Mm below the photosphere. The top panel is showing flow speed in meter per second while the bottom panel shows rotation rate in nHz (Adapted from Corbard & Thompson, 2002, Solar Phys, 205, 211). Data are provided by Jesper Schou and the SDO/HMI Team.